Overview
This is an article in a series of Sitecore how-to articles. These articles are meant to be quick guides to accomplish various tasks within Sitecore. The how-to articles have proven to be very helpful internally at One North https://www.onenorth.com. These articles assume working Sitecore knowledge. I just wanted to share the articles with the community. Hopefully you find them helpful.
How-To
After you set up a site, you might want to debug the process to figure out variable information and everything else. Here’s how you’d go about setting up the debugging process.
Step-by-step guide
- Open up your visual studio process as an administrator
- Click on
Debug→Attach to process - Make sure the
Show processes from all userscheckbox is checked and search for thew3wp.exeprocess.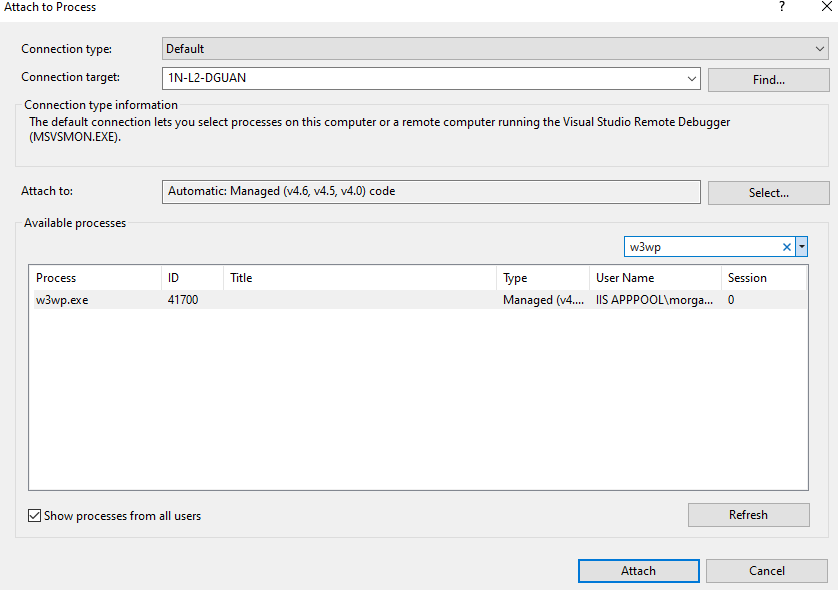
- If there are multiple processes, you could attach to all of them by holding down Ctrl and clicking on the process. Alternatively, you could run this to find out what Application pool the
w3wp.exepoints to. How to identify which w3wp.exe belongs to which Application Pool - Set a breakpoint wherever you want the process to stop. For example:
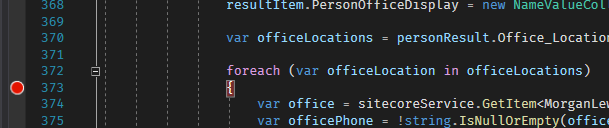
- Get that portion of code to rerun, either through a page reload or a button click or however the code generates. Most code runs on page load, so refreshing the page should work, but for forms you can test through a button click instead.
- There are a few buttons here that are useful for debugging. This is defined clearly in the Microsoft documentation: https://docs.microsoft.com/en-us/visualstudio/debugger/debugger-feature-tour?view=vs-2019
- The most useful one I’ve found is the step over function, or F10, that goes to the next line.